Building a live leaderboard in oTree

Anyone who has run a classroom experiment knows the moment. Participants finish the task, put down their laptops, and immediately ask: “So how did everyone else do?” Usually, the honest answer is “I will show you next week once I have cleaned the data.” By next week, the moment is gone.
For a teaching case on AI reliance in auditing that Therese Grohnert and I built for the Foundation for Auditing Research (FAR) and has as of October 2026 been used by more than 1,600 auditors, I wanted to avoid exactly that. In the case, participants act as auditors and review cattle counts on four drone photographs of a Dutch agricultural client (adapted from Peters, 2026). Half of the participants are told the counts come from an AI tool (“DroneCount AI”), the other half that they come from a human colleague (“J. de Vries”). The counts are identical across conditions: two photographs are counted correctly, two contain overcounts. The interesting question is whether the label changes how carefully people review.
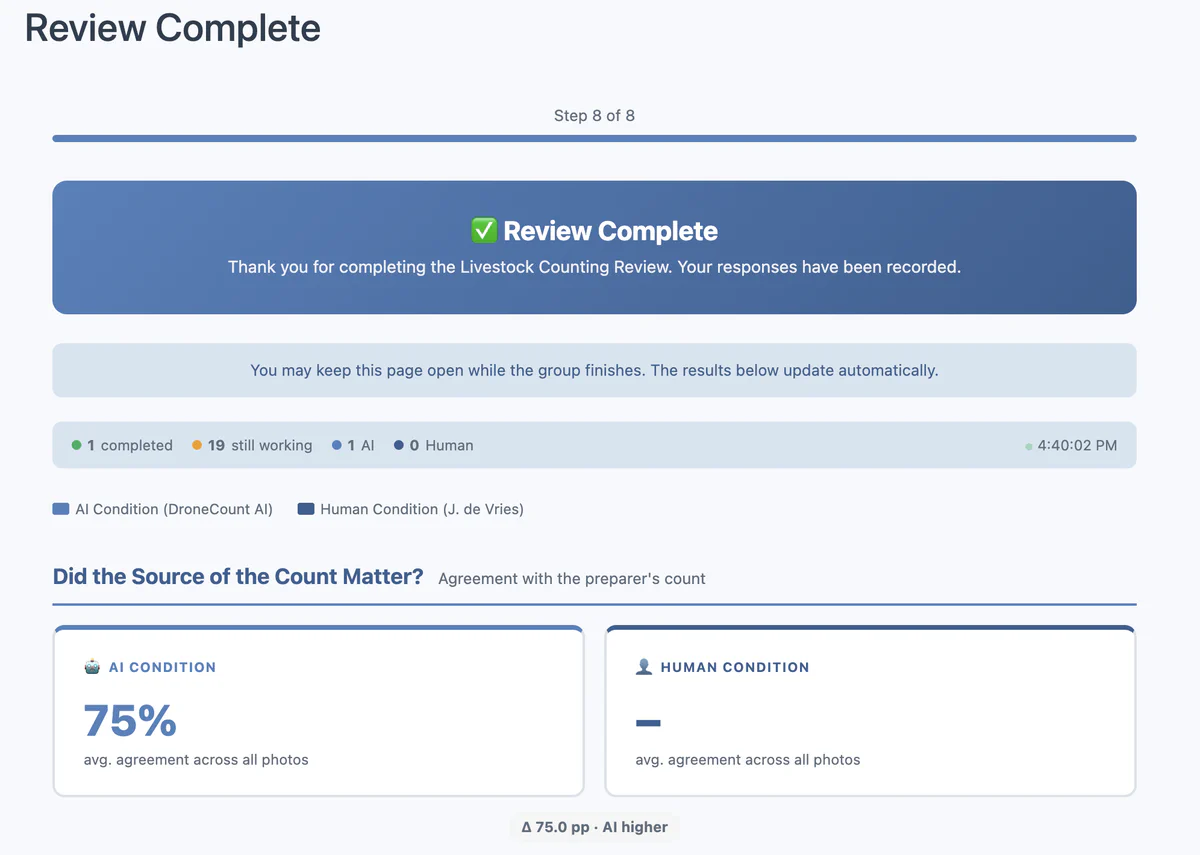
The case only works as a teaching tool if participants can see the answer to that question right away, while they still remember what they did. So once participants finish, they land on a results page that updates live as the rest of the room completes the task: how often each condition agreed with the counts, how many errors were caught, how long people looked at each photograph, and so on, split by AI versus human source. The facilitator can then walk straight into the discussion.
You can try it yourself here: demo of the AI reliance teaching case. The best way to see the leaderboard in action is to open the session-wide link in a few browser tabs (or send it to some colleagues), complete the task in each, and watch the results page change.
In the remainder of this post, I explain how to build such a live leaderboard in oTree. It is less work than you may think.
The building block: oTree live pages
Since oTree 5, every page can be a “live page.” A live page keeps a websocket connection open between the participant’s browser and the server, so that both sides can send messages to each other without the participant clicking “Next.” Live pages are mostly known from real-time market experiments and bargaining games, but they work just as well for displaying results.
A live page consists of three pieces:
- A
live_methodon the page class in__init__.py. This function runs on the server whenever the browser sends a message. - A JavaScript function
liveSend(...)in the template, which sends a message to the server. - A JavaScript function
liveRecv(data)in the template, which oTree calls whenever the server sends something back.
That is all we need for a leaderboard: the browser asks “what are the current results?”, the server computes them from the database, and the browser redraws the page.
Step 1: Compute the results on the server
I recommend putting the aggregation in a separate helper function rather than inside the page class. That way you can reuse it for the initial page load, the live updates, and, if you like, a facilitator dashboard.
The structure below is a simplified version of what the teaching case uses:
def compute_leaderboard(player):
    """Aggregate results for the current session.
    Returns a JSON-safe dict without participant identifiers."""
    players = player.subsession.get_players()

    # Only count participants who actually finished
    completed = [
        p for p in players
        if p.field_maybe_none('confidence') is not None
    ]

    def summarize(group):
        n = len(group)
        if n == 0:
            return dict(n=0, errors_caught=None, mean_time=None)
        return dict(
            n=n,
            errors_caught=round(
                sum(p.errors_caught for p in group) / n, 2
            ),
            mean_time=round(
                sum(p.total_time_spent for p in group) / n, 1
            ),
        )

    return dict(
        ai=summarize([p for p in completed if p.condition == 'ai']),
        human=summarize([p for p in completed if p.condition == 'human']),
        n_in_progress=len(players) - len(completed),
    )
A few things to note here. First, player.subsession.get_players() gives you everyone in the session, not only the participant’s group. In the teaching case, everyone is in one large group (PLAYERS_PER_GROUP = None), but using the subsession makes the function independent of your grouping. Second, use field_maybe_none() for fields that participants may not have filled in yet. Otherwise, oTree raises an error the moment you touch a participant who is still on page two. Third, only return aggregates. The payload is sent to the browser, so anything you put in it can be seen by a curious participant who opens the developer tools.
Step 2: Make the results page a live page
The page class then needs two things: js_vars to hand the current results to the template when the page first loads, and a live_method to answer later requests.
class Results(Page):

    @staticmethod
    def js_vars(player):
        return dict(initial=compute_leaderboard(player))

    @staticmethod
    def live_method(player, data):
        return {player.id_in_group: compute_leaderboard(player)}
The return value of a live_method is a dictionary that tells oTree who receives the message. The key player.id_in_group means “send this back to the participant who asked.” If you use the key 0 instead, oTree sends the message to every member of the group who is currently on this page.
The js_vars part is not strictly necessary, but it avoids an empty page during the first second or two before the first live message arrives.
Step 3: Ask for updates and redraw in the template
In the HTML template, we draw the initial results, then ask the server for fresh numbers every few seconds:
{{ block content }}
<h3>How did the group do?</h3>
<div id="leaderboard"></div>
<p id="waiting"></p>

<script>
function render(d) {
    function fmt(v) { return v === null ? '–' : v; }
    document.getElementById('leaderboard').innerHTML =
        '<table class="table">' +
        '<tr><th></th><th>AI source</th><th>Human source</th></tr>' +
        '<tr><td>Participants finished</td><td>' + d.ai.n + '</td><td>' + d.human.n + '</td></tr>' +
        '<tr><td>Errors caught (of 2)</td><td>' + fmt(d.ai.errors_caught) + '</td><td>' + fmt(d.human.errors_caught) + '</td></tr>' +
        '<tr><td>Review time (sec.)</td><td>' + fmt(d.ai.mean_time) + '</td><td>' + fmt(d.human.mean_time) + '</td></tr>' +
        '</table>';
    document.getElementById('waiting').innerText =
        d.n_in_progress + ' participant(s) still working.';
}

function liveRecv(data) {
    render(data);
}

document.addEventListener('DOMContentLoaded', function () {
    render(js_vars.initial);
    liveSend({type: 'refresh'});
    setInterval(function () { liveSend({type: 'refresh'}); }, 5000);
});
</script>
{{ endblock }}
That is a working live leaderboard. The teaching case does exactly this, only with more metrics and horizontal bar charts drawn in plain HTML and CSS instead of a table. You do not need a charting library for this. A div with a percentage width works surprisingly well, and it keeps the app free of external dependencies.
Why poll instead of push?
You may wonder why every browser asks for an update every five seconds rather than the server pushing new results the moment someone finishes. The reason is a limitation of oTree’s live pages: a message can only be sent from within a live_method, and only to participants who are currently on that live page. When a participant submits the last questionnaire page, that happens in a regular page submission (e.g., before_next_page), not in a live_method, so there is no natural moment to push a message to everyone else.
There is a way around this. When a participant arrives on the results page, their first liveSend call triggers the live_method, and you could return the new results with the key 0 to broadcast them to everybody already on the page. That works, but polling is simpler, easier to debug, and five seconds of delay is irrelevant in a classroom. With 50 or 60 participants each polling every five seconds, the server load is negligible even on the smallest Heroku dyno.
From “results page” to “leaderboard”
In the teaching case, the leaderboard compares conditions rather than individuals, because the point of the exercise is the treatment effect and not who the best auditor in the room is. But the same code gives you a classic ranked leaderboard if that suits your setting, for instance in a competition or a tournament incentive scheme. Rank the completed players in compute_leaderboard and return the top entries:
ranked = sorted(completed, key=lambda p: p.payoff, reverse=True)
top10 = [
    dict(label=f"Participant {p.id_in_group}", score=float(p.payoff))
    for p in ranked[:10]
]
Two warnings if you go down that road. First, think carefully about what you display. Participant codes and labels from a room can be traced back to people sitting next to each other, so use neutral labels or let participants pick a nickname. Second, in a research setting, a leaderboard that is visible during the task is a manipulation in itself. Relative performance feedback changes effort, risk taking, and even honesty, so it should be part of your design and not a nice add-on. Showing results only after the main task, as in the teaching case, avoids that problem.
A dashboard for the facilitator
For the teaching case, I also wanted a separate facilitator view that I could project on the screen, with more detail than participants see and a button to export the data. Live pages only work for participants, so this dashboard is a separate page served through a custom route that reads the same database and reuses the same aggregation logic. That is beyond the scope of this post, but the principle is the same: compute aggregates on the server, fetch them from the browser every few seconds, redraw. If you only need something quick, oTree’s built-in session monitor and the data tab already go a long way.
Some practical tips
- Test with several browsers at once. Open the session-wide link in a normal window, a private window, and a second browser. oTree’s demo mode makes this easy, and it is the only way to see whether the numbers update correctly while others are still working.
- Handle the empty state. The first participant to finish sees a leaderboard based on one person. Show “–” or a “waiting for others” message rather than percentages that jump from 0% to 100%.
- Keep the computation cheap. Every poll runs
compute_leaderboardfor every participant on the page. Simple loops over a few hundred players are fine. If you are computing anything heavy, cache it in a session variable. - Remember that live pages do not survive everything. If a participant’s connection drops, the page reconnects when they reload. Make sure the page can always draw itself from
js_varsalone. - Do not leak the answer key. If your results page reveals correct answers, make sure it comes after the last page where participants can still change anything.
Final note
Live leaderboards are one of those features that look like they require a lot of web development but are really a few lines of Python and JavaScript on top of oTree’s live pages. In my experience, they change the atmosphere of a classroom experiment completely. Participants stay engaged after they finish, the discussion starts from their own behavior rather than from a slide with last year’s results, and the facilitator does not need to prepare anything between the task and the debrief.
If you want to see how this looks in practice, try the demo. And if you build something similar for your own experiments or classes, I would love to hear about it.
References