Using animations in your instructions
Many experiments use instructions to explain the experimental setting to participants. Without instructions, the quality of your data may suffer as participants do not understand what is expected of them. A common way to explain the experimental setting to participants is with textual instructions. Yet, comprising concise, informative textual instructions is challenging. Do you use bullet points? Is your font comfortable to read? How much text do I use on every page? How do I make sure participants read all instructions? Do I quiz participants? If so, how much? Do I screen participants for their understanding of the experiment? Irregardless of your answers to the previous questions, this posts discusses how animations could be an alternative way to complement your textual instructions.
Animations are visualizations
Animations are moving pictures that visualize the information you wish to convey to participants. If you have some experience teaching students or giving presentations to large audiences, you may have noticed that humans find it easier to digest visuals than large amounts of text. The same principle holds for instructions in experiments. Participants find it much easier and comfortable to digest a visual such as animation than read a long list of bullet points or a large paragraph. Thus, even if textual instructions are central to the way you explain the experimental setting to participants, you may want complement these textual instructions with an animation. Now please do not get the wrong impression. My suggestion is not to completely go “Vincent van Gogh” on your instructions. I merely am proposing that some experiments may benefit from an animation that visualizes the information that you wish you convey in the simplest and least obtrusive way possible.
Tax Investment Example
In a recent experiment by Bart Dierynck, Martin Jacob, Maximilian Müller, Christian Peters, and myself, we wanted to explain, as simply as possible, a method used by firms to lower their tax burden in countries.
Specifically, we wanted to explain how some countries offer tax credits to firms, which lower tax payments based on how much they invest in that particular country. It would be challening to explain this tax strategy to participants by solely relying on textual instructions.
Thus, after constructing a concise set of textual instructions on a page, we also created an animation that visualizes the underlying process of this tax strategy.
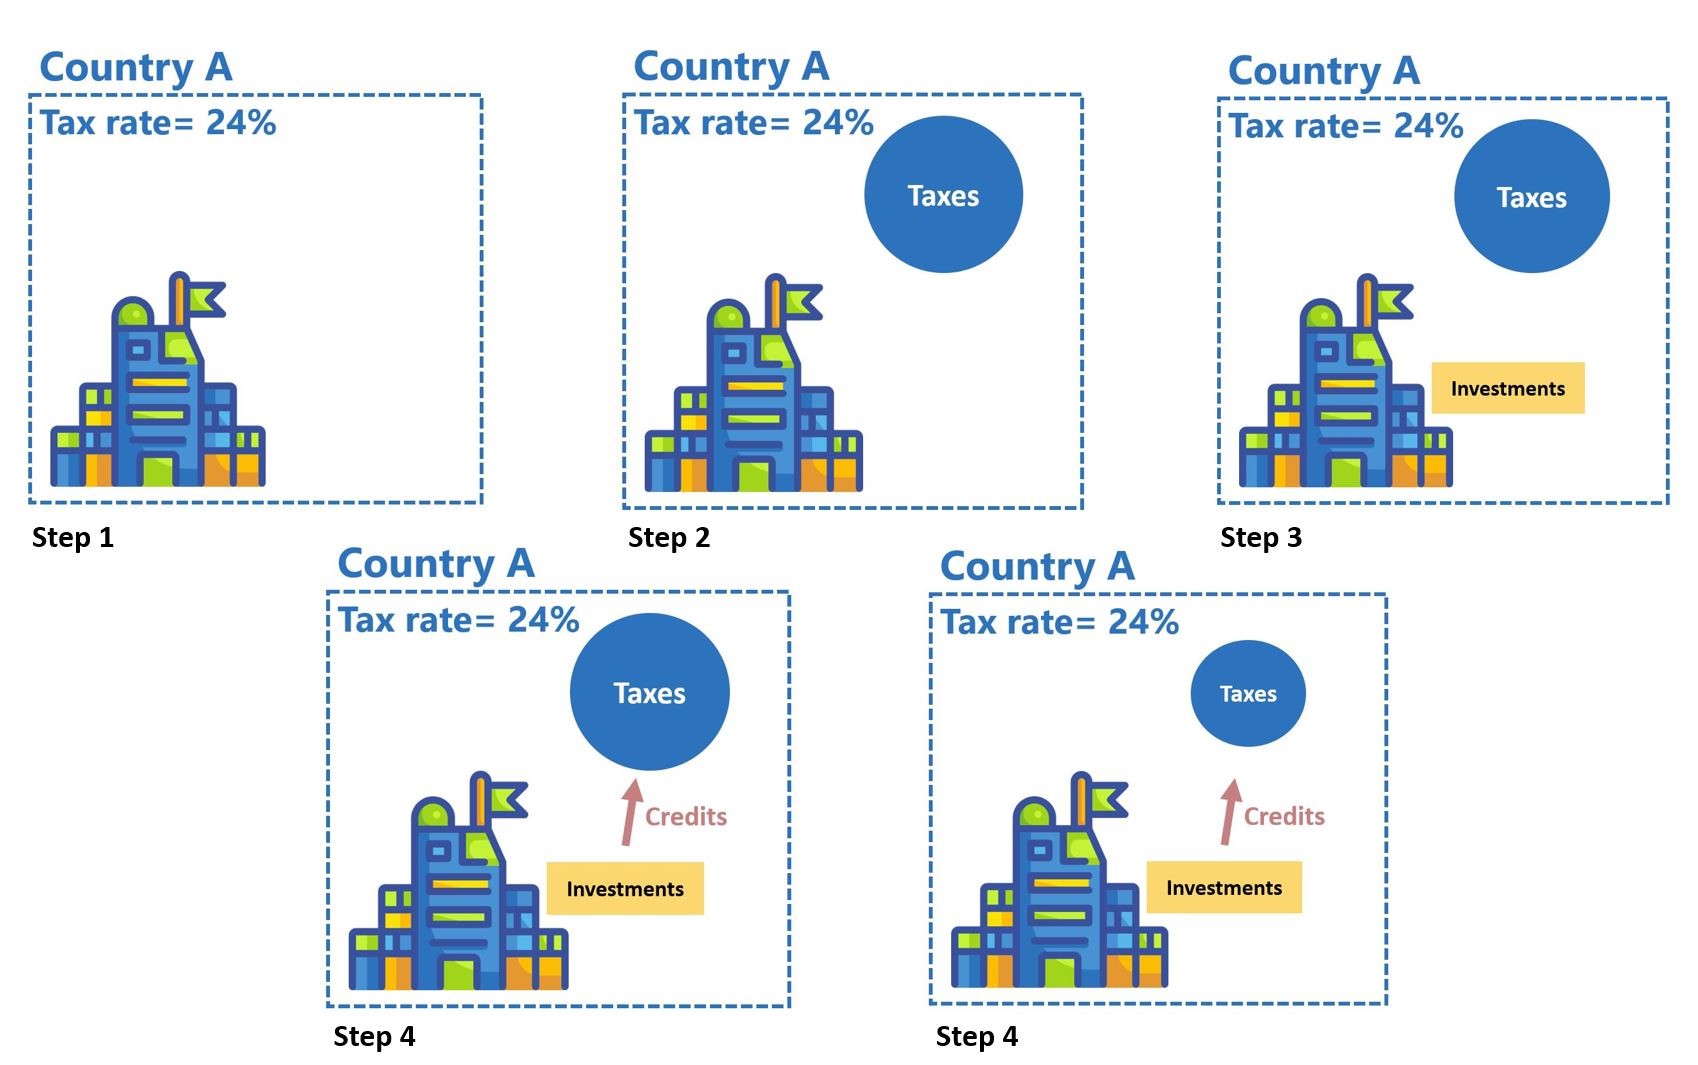 A simple way to visualize this process is with Powerpoint using figures from databases like FlatIcon.com.
The figure above shows five Powerpoint slides each corresponding to one step of the animation.
In step one, we introduce the firm and explain that it operates in Country A, which has a tax rate of 24%.
In step two, we show that this firm pays taxes in Country A with a circle, and we subsequently reveal that the firm also makes investments into its operations in Country A in step three.
The fourth step introduces the notion of tax credits offered by Country A. The last step shows how these tax credits lower the taxes paid by the firm in Country A by shrinking the tax circle.
A simple way to visualize this process is with Powerpoint using figures from databases like FlatIcon.com.
The figure above shows five Powerpoint slides each corresponding to one step of the animation.
In step one, we introduce the firm and explain that it operates in Country A, which has a tax rate of 24%.
In step two, we show that this firm pays taxes in Country A with a circle, and we subsequently reveal that the firm also makes investments into its operations in Country A in step three.
The fourth step introduces the notion of tax credits offered by Country A. The last step shows how these tax credits lower the taxes paid by the firm in Country A by shrinking the tax circle.
Recording your animation
After you have created each step of your process in a program like Powerpoint, you proceed to record the animation. One way to create animations is with ScreenToGif.
This editor enables you to record an animation and save it as a GIF on your computer. The best way to record your animation is to launch ScreenToGif, start recording, go into presenter mode in Powerpoint, and cycle through each step in Powerpoint with a predetermined interval (e.g., 2-3 seconds per step).
After reaching the last step and finishing its interval, stop the recording and save your recording as a GIF. The finished product is displayed below.
How to reference this online article?
Van Pelt, V. F. J. (2020, March 18). Using animations in your instructions. Accounting Experiments, Available at: https://www.accountingexperiments.com/post/visuals-instructions/.